Technical revision: 1 October 2026 · Educational material
An indicator is a way to transform observations. Before selecting one, write down the question it should answer. A colorful chart or a product name is not evidence that the output improves your strategy. This guide compares five useful types of tools without ranking unnamed commercial products.
1. Trend and moving-average distance
A moving average summarizes recent prices; the difference between price and the average measures displacement. The downloadable FtsMADistance.mq5 provides a transparent starting point. Its inputs and calculation are visible, so you can manually verify several outputs.
A multi-timeframe version requires additional care. During an unfinished higher-timeframe candle, its value may change. Record which timeframe and bar shift generated a decision rather than comparing a finalized historical value with an earlier live observation.
2. Volatility tools such as ATR
ATR summarizes recent true ranges. It can help describe the scale of recent movement, but it does not predict direction or guarantee a stop distance. If used to size an exit, specify the calculation period, timeframe and closed-bar shift.
In MQL5, iATR creates a handle; values are read separately with CopyBuffer. An MQL4-style call that includes a final bar-shift argument does not belong in an MQL5 EA.
3. Momentum oscillators
RSI and related oscillators describe a particular price transformation. A threshold crossing is a proposed rule, not a universal reversal signal. Specify whether the rule acts on a closed candle, whether repeated readings can create repeated entries, and how it behaves during persistent trends.
4. Channel and range tools
A channel based on earlier highs and lows can define a breakout reference. Check whether the reference excludes the candle being tested. Including a current candle’s high in the same candle’s breakout threshold can make the rule impossible or different from its description.
Tools that confirm swing points using future bars also need explicit confirmation timing. A marker placed back on the original swing candle becomes available only later; a backtest must not act on it before confirmation.
5. Session and spread diagnostics
A session overlay can help describe time-of-day behavior. Record the broker’s server timezone and any daylight-saving changes. A spread monitor measures a cost component, which can be especially relevant around thin trading periods.
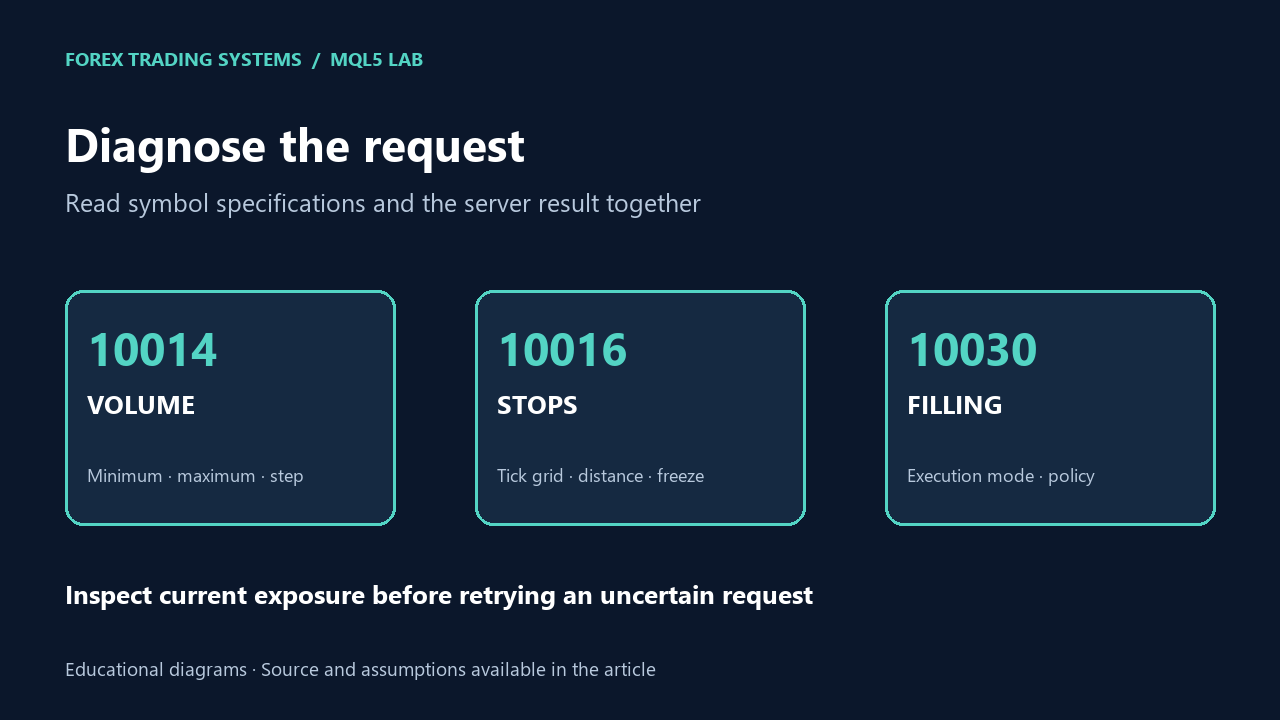
The package includes FtsSymbolDiagnostics.mq5 to log the current quote and contract constraints. It is a specification snapshot, not a historical spread dataset or a signal generator.
Evaluate a candidate with a small comparison
| Question | Useful evidence |
|---|---|
| When is the value available? | Bar shift, confirmation delay and live observations. |
| Does history change? | Saved outputs compared after more bars arrive. |
| What are the units? | Price, points, percentages or a dimensionless scale. |
| Does it help the rule? | A baseline comparison with the same costs and an untouched validation period. |
Begin with the custom indicator lesson, then follow the validation checklist. Add a tool only when its contribution and timing can be explained.